

Unified analytics dashboard for administrators, teachers, and students.

Dashboard Overview
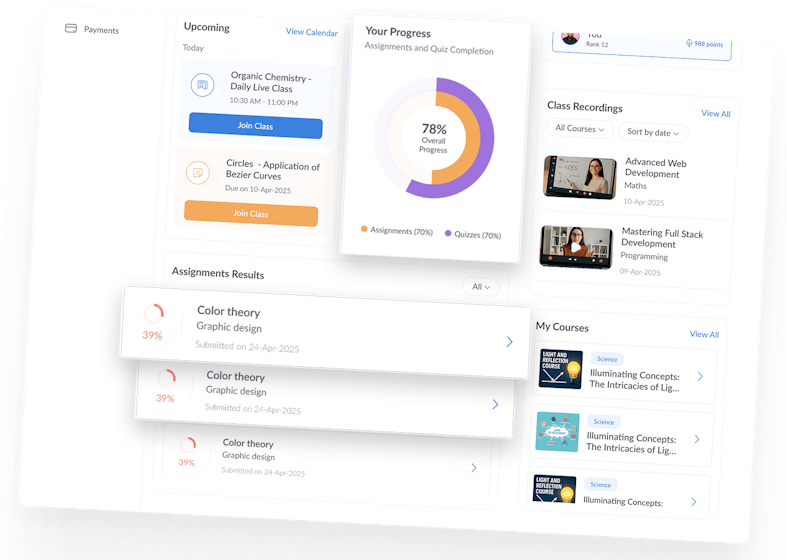
At-a-glance insights – total active students, attendance percentage, completion rates, and performance summaries.

Institutional Analytics
Overall academic performance summary across grades, cohorts, and subjects.

Student Performance Analytics
Individual progress tracking – course completion %, grades, time spent on platform, and test performance.

Reports Generation & Export
Generate automated reports for: Attendance, Academic performance, Behavior & engagement trend.


Predictions for student dropout or low performance risk.

Learning path recommendations based on historical performance.

Performance forecasting – estimate outcomes based on current trends.

Integration with LMS and ERP modules for unified reporting.


Designed for Every Role

For Teachers
Monitor individual and class-wide learning progress. Get reminders to follow up with struggling students. Adjust pace and focus based on real-time data.

For Admins
Benchmark across cohorts or programs. Spot trends, identify gaps in the curriculum, and inform your strategic decisions.

For Institutions
Track academic performance at scale, over time. Use report-ready data to support accreditation, communication with parents, or board reporting.

